A WinDbg Debugging Journey - NHibernate Memory Leak
Disclaimer: This is not a stab at the NHibernate team. They are doing an awesome job, it might as well (and for a long time I thought it was) have been in my own code. In addition - the memory leak is already solved on the NHibernate trunk.
Introduction
A few weeks back, an ASP.NET application (using NHibernate 2.0.0.4000) I am running got under heavier load than usual. I had noted that the memory usage was slightly high earlier, but it had never been a real problem - this is all the server is doing. However, under heavier load, memory pressure started approaching 700-800mb and the dreaded OutOfMemoryException started appearing when doing big chunks of work.
To be honest, I have never done much memory debugging - learning opportunity! If you do a sweep of the web these days on .NET and debugging, you will no doubt find the blog of Tess Ferrandez, who is an ASP.NET Escalation Engineer working at Microsoft. She has even done a lab series aptly named buggy bits that ease you through debugging and identifying various kinds of application problems.
After reading through her articles and watching her TechEd presentation on the subject, I downloaded WinDbg, configured it as Tess had described and started experimenting. This blog post will describe my journey and hopefully help other solve similar problems.
The Puzzle
The first thing I did was to grab a memory with adplus, one of the tools included with WinDbg. From my understanding, it stops the application momentarily and just writes the entire contents of memory to disk. This produced a huge .DMP file - a memory dump. My managed heap was at around 800mb at the time, but the dump file was slightly bigger.
Working with WinDbg is not your standard draggy-droppy windows application, it looks sort of like a console and you type bizarre command and it produces even more bizarre output for you to reason about. I started out using the !eeheap -gc command, which produces some basic information about your heaps.
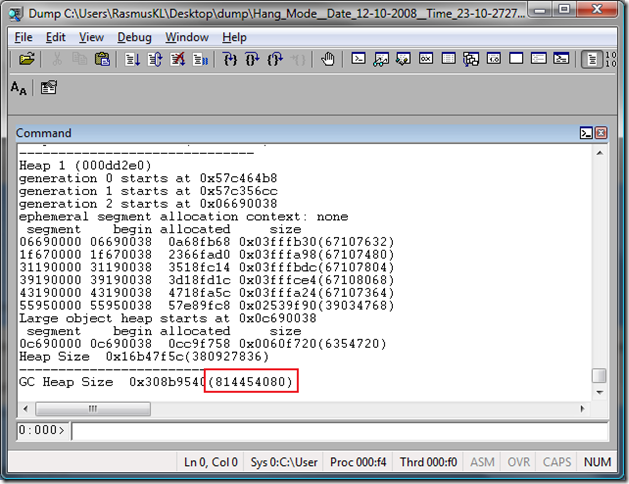
As you can see, my heap size was around 814mb. If you dig into the information (not all shown on screenshot), you will find that my garbage collectors generation 2 is much bigger than generation 0 and 1. (You can read more about garbage collection and generational garbage collection here.)
After looking at this, I fired off the !dumpheap -stat command to get an overview of the objects in the heap.
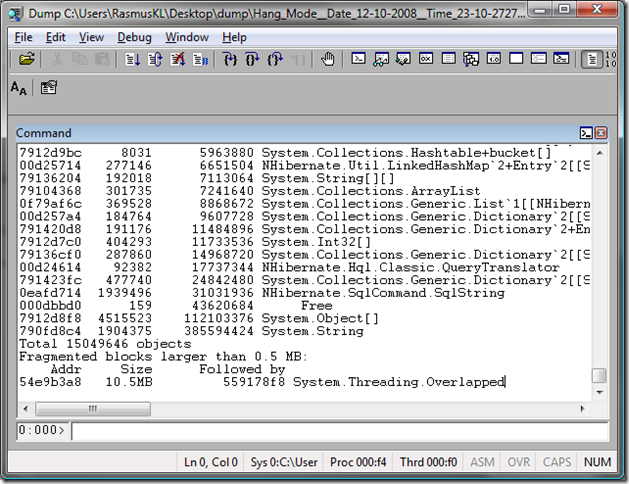
The output looked like that, the first column denoting the type of object, second is number of objects, third is the shallow size of the objects, that is, not including whatever it references - the fourth is the type name.
Now, the first time I looked at this, I noted the NHibernate objects but focused more on the 385mb of strings - usually, SELECT isn't broken - I was convinced this was a problem in my code. I dug a bit deeper but didn't really find much, partly because WinDbg isn't super easy. This lead me to find some other places in my code that needed StringBuilders, but this proved not to be the root cause (thanks anyway Søren).
Later, when thinking about the problem, it came to me that that maybe 1.9 million NHibernate SqlStrings was a wee bit too many. I decided to did deeper into this - I found the SqlString in my list and found that the type is denoted with 0eafd714. Now, !dumpheap can do more that just give you statistics, it can give you filtered lists using various arguments. I wanted to sample some instances of these SqlStrings to see where they were bounded, so I used the command !dumpheap -mt 0eafd714. This makes WinDbg give me a list of all the instances of the NHibernate SqlString - this is a very long list.
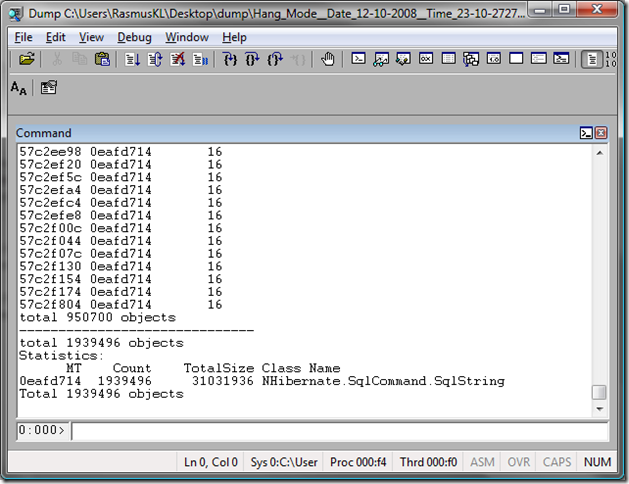
Now, the second column denotes the type, the third is the shallow object size and the first is what we are looking for - the instance address. I picked a few of them at random and used the !gcroot command to show where they were rooted. That is, give me the chain of references that lead to this object. An example is !gcroot 57c2f130, which produces the following output.
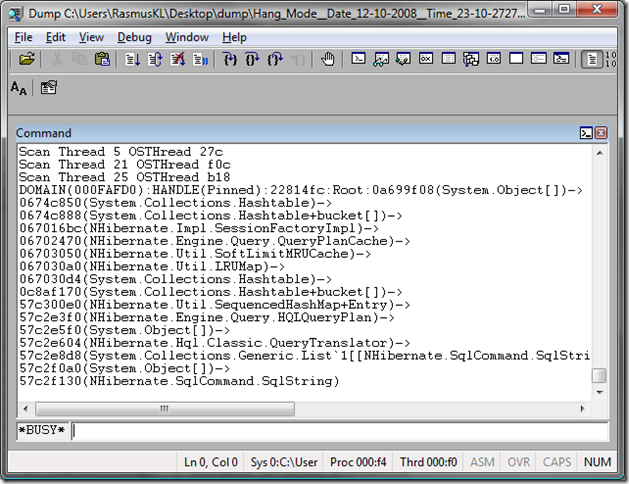
You can see the actual instance at the bottom and then follow the chain upwards. It seems this current SqlString is rooted in a QueryPlanCache in the NHibernate SessionFactory.
At this point I actually downloaded the NHibernate source and started looking around. Conceptually, the NHibernate SessionFactory keeps a cache of recent HQL queries, so it doesn't have to rebuild them. According to the source code, it would store the 128 most recently used queries.
Now WinDbg can actually tell you the "deep" size of an object, object size + objects it references. This is done using the !objsize command. Now this literally took several hours of processing, so I don't have a screenshot for the blog post, but executing !objsize 067016bc command should give me the memory size of my SessionFactory. According to my log file, it told me:
sizeof(067016bc) = 716798348 ( 0x2ab9798c) bytes (NHibernate.Impl.SessionFactoryImpl)
That is one big SessionFactory (~700mb). I dug further down the reference chain to try and figure out what was wrong with the cache. Remember I said that this cache was supposed to hold 128 queries. When I got to the hashtable in the cache and dumped it using the !do 067030d4 command, it revealed the following:
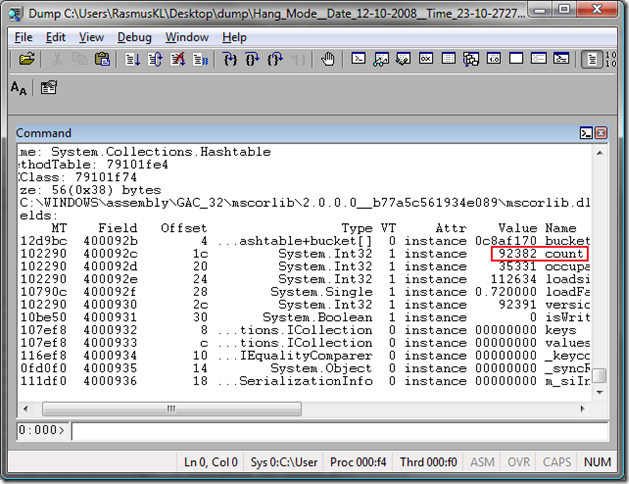
According to this, my cache contains 92000 queries. After digging around in the code, writing a few unit tests and getting some help from the NHibernate user group, I finally found out that it was a bug in the object indexer in the LRUMap, such that it didn't enforce the 128 limit properly.
It was a small innocent bug, but having a 700mb (and growing) hashtable hanging around in your system forever is not really that pleasant. I ended up writing a hack that used reflection to access the field that contained the cache and clearing it periodically. It is already fixed on the NHibernate trunk, but I haven't gotten around to updating yet.
Since implementing my clear hack, I haven't seen memory usages above 50mb.
Conclusion
I've told my small debugging tale of how I got introduced to WinDbg and how it helped me track down a major issue in my application and reduce memory usage from ~800mb to ~50mb. It's a funky tool and can be quite scary at first, but if it helps me remove memory leaks, I am all for it. The second lesson learned is that sometimes - although I still won't look there first - SELECT is broken.